
The problem is not always a lack of data.
Often, the problem is that the information people need to make decisions is scattered across different places.
A data dashboard brings important metrics together into a visual, easy-to-understand view. Instead of searching through spreadsheets, opening multiple systems, or waiting for another report, teams can see what is happening across the business much more quickly.
But a useful dashboard is more than a collection of colourful charts.
It should answer specific business questions, track the right key performance indicators (KPIs), provide context, and help people recognize when something needs attention.
So, what is a data dashboard and why does it matter? This guide explains how dashboards work, what they show, the different types of dashboards, how they differ from reports, and what makes a dashboard genuinely useful for business decision-making.
Quick Answer: What Is a Data Dashboard?
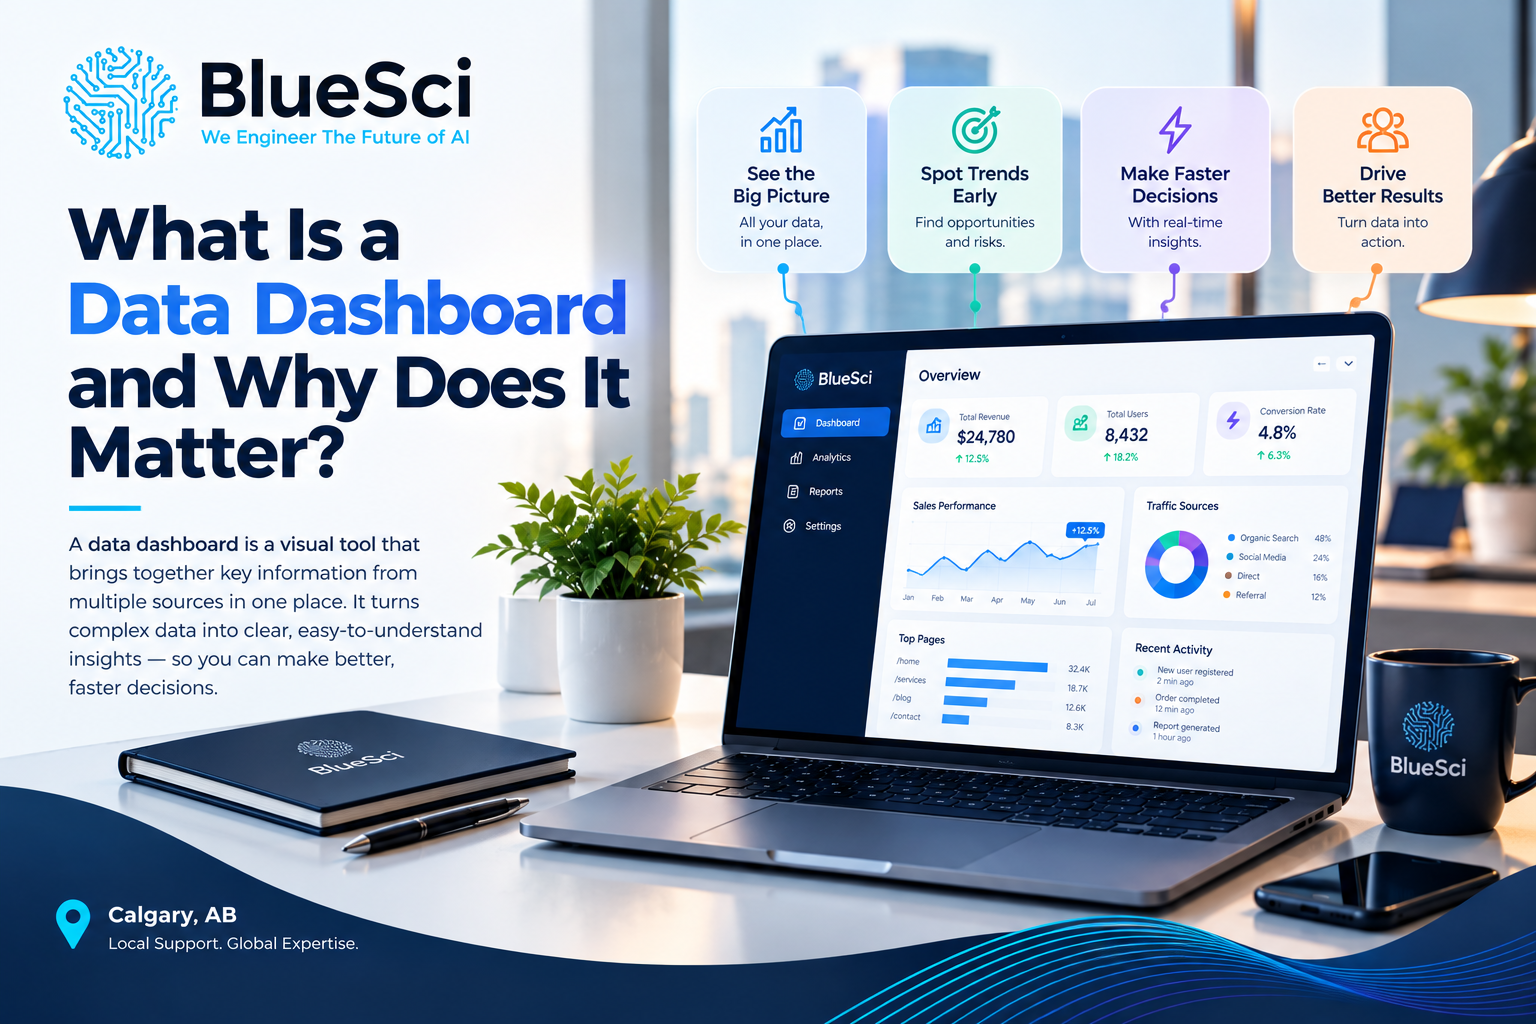
A data dashboard is a visual interface that brings important metrics, KPIs, charts, and other business information together in one place so people can quickly understand performance and make informed decisions.
A dashboard can pull information from sources such as CRM platforms, financial systems, spreadsheets, databases, operational applications, and other business tools.
Depending on how it is designed, the data may refresh in real time, near real time, or on a scheduled basis.
The purpose is simple: turn scattered data into a clear view of what matters.
What Does a Data Dashboard Actually Show?
A dashboard does not need to display every piece of data a company collects.
In fact, trying to show everything usually makes a dashboard less useful.
A good dashboard focuses attention on the information required for a specific purpose.
Depending on the business and audience, that information might include:
- revenue,
- sales pipeline value,
- conversion rates,
- new customers,
- operating costs,
- profitability,
- inventory levels,
- order volume,
- customer support requests,
- project status,
- website performance, or
- other key performance indicators.
The information may appear as numbers, charts, graphs, tables, indicators, trends, targets, or filters.
What matters is not how many visualizations are on the screen.
What matters is whether the dashboard helps its intended user understand something important and decide what to do next.
How Does a Data Dashboard Work?
A dashboard is essentially a visual layer sitting on top of business data.
The information itself may live in several different places.
A typical dashboard process looks something like this:
- Business systems generate or store data.
- The relevant data is connected or collected.
- Metrics and KPIs are defined.
- The data is prepared for analysis.
- The dashboard presents those metrics visually.
- The information refreshes according to the required schedule.
- Users monitor, filter, compare, and investigate the results.
For example, a sales dashboard might combine data from a CRM, accounting system, marketing platform, and spreadsheet.
Instead of opening all four sources separately, a manager could see the most important information in one view.
Why Do Data Dashboards Matter?
The value of a dashboard is not the dashboard itself.
Its value comes from making business information easier to understand and use.
1. Dashboards Save Time
Without a dashboard, employees may need to open multiple applications, export data, update spreadsheets, combine numbers manually, and prepare reports before they can answer a relatively simple business question.
A connected dashboard can reduce that repeated effort by bringing the relevant information together automatically.
2. Dashboards Make Important Information Easier to See
Rows of numbers can contain valuable information, but important patterns may be difficult to recognize quickly.
Visualizing those numbers can make trends, changes, comparisons, and unusual results easier to identify.
3. Dashboards Help Track KPIs
A dashboard can show whether important metrics are moving toward or away from a target.
Instead of simply seeing that revenue is $500,000, for example, a dashboard could show:
- the target,
- current performance,
- performance during the previous period, and
- the trend over time.
That context makes the number much more useful.
4. Dashboards Can Reveal Problems Earlier
Changes in important metrics can indicate that something needs attention.
A sudden drop in sales conversions, an increase in support requests, declining inventory, rising costs, or a growing operational backlog may become easier to recognize when those measures are being monitored consistently.
5. Dashboards Support Faster Decisions
When decision-makers can access relevant information without waiting for someone to manually prepare a report, they can investigate and respond more quickly.
The dashboard does not make the decision for them.
It gives them a clearer view of the information needed to make it.
6. Dashboards Can Give Teams a Shared View
Different departments sometimes maintain separate spreadsheets or reports for the same business metric.
This can create disagreements about which number is correct.
A properly designed dashboard built on agreed data sources and metric definitions can provide a more consistent view of performance across the organization.
A Simple Business Dashboard Example
Imagine a company wants to understand sales performance.
Without a dashboard, the sales manager might:
- open the CRM,
- export opportunity data,
- open the accounting system,
- check actual revenue,
- review a spreadsheet containing monthly targets,
- compare the numbers manually, and
- prepare a report for management.
A sales dashboard could instead bring together metrics such as:
- revenue this month,
- revenue versus target,
- sales pipeline value,
- number of new opportunities,
- average deal size,
- conversion rate, and
- performance by salesperson or region.
The manager can then see both current performance and the context around it without rebuilding the analysis each time.
That is the practical difference a useful dashboard can make.
Data Dashboard vs. Report: What Is the Difference?
Dashboards and reports both communicate data, but they usually serve different purposes.
| Data Dashboard | Report |
|---|---|
| Designed for monitoring | Often designed for detailed analysis or documentation |
| Can update automatically | Often represents a particular period or point in time |
| Usually highly visual | May contain detailed tables, text, and explanations |
| Can include filters and drill-downs | Often more static |
| Helps users see what needs attention | Can provide deeper explanation of what happened |
Neither is automatically better.
A dashboard is useful when people need to monitor information repeatedly. A report may be more appropriate when they need detailed analysis, documentation, or explanation.
Dashboard vs. Data Visualization
A data visualization is an individual visual representation of information, such as a line chart, bar chart, map, or graph.
A dashboard usually combines multiple visualizations, metrics, and controls into one interface.
For example, a line chart showing monthly revenue is a data visualization.
A sales dashboard might contain that revenue chart along with pipeline value, conversion rates, sales targets, regional performance, and filters.
In other words:
A visualization communicates one part of the story. A dashboard brings several important parts together.
What Are the Main Types of Data Dashboards?
Dashboards are often grouped into four broad categories: operational, analytical, strategic, and tactical.
Operational Dashboards
Operational dashboards focus on what is happening now or in the immediate future.
They may track:
- current order volume,
- open support tickets,
- inventory status,
- system activity, or
- daily operational performance.
Because these dashboards support day-to-day operations, they may require frequent or real-time updates.
Analytical Dashboards
Analytical dashboards help users explore data more deeply.
They may include historical trends, comparisons, filters, segmentation, and drill-down capabilities.
The objective is often to understand not only what happened, but also investigate why.
Strategic Dashboards
Strategic dashboards provide a higher-level view of progress toward important organizational goals.
Executives might use them to monitor revenue growth, profitability, customer growth, strategic targets, or other organization-wide KPIs.
Tactical Dashboards
Tactical dashboards sit between day-to-day operations and long-term strategy.
A department manager might use one to track monthly campaign performance, regional sales, project delivery, or team productivity against targets.
What KPIs Should a Data Dashboard Track?
This is one of the most important questions in dashboard design.
The answer is not “as many as possible.”
The right KPIs depend on:
- who will use the dashboard,
- what decisions they need to make,
- what goals they are responsible for, and
- what actions they can take based on the information.
An executive and a frontline operations manager may need completely different dashboards even when they work for the same company.
Before selecting charts or dashboard software, define what the dashboard needs to help the user understand.
A useful question is:
“What decisions should someone be able to make after looking at this dashboard?”
That question is often more valuable than asking which charts should appear on the screen.
Examples of Data Dashboards by Department
Dashboards can be built for many areas of a business.
Sales Dashboard
May track revenue, pipeline value, conversion rate, average deal size, sales targets, and salesperson performance.
Finance Dashboard
May display revenue, expenses, cash flow, budget versus actual performance, margins, and outstanding receivables.
Marketing Dashboard
Could monitor website traffic, leads, conversion rates, campaign performance, acquisition costs, and marketing channels.
Operations Dashboard
May track order volume, production, inventory, turnaround times, backlog, service levels, or operational exceptions.
Executive Dashboard
Usually focuses on a smaller number of high-level KPIs that show overall organizational performance and progress toward strategic objectives.
Customer Service Dashboard
Could include ticket volume, response times, resolution times, open cases, recurring issues, and other service metrics.
What Makes a Good Data Dashboard?
A technically impressive dashboard can still fail if people cannot understand or use it.
Good dashboards usually share several characteristics.
It Has a Clear Purpose
You should be able to explain what the dashboard is for in a sentence.
If its purpose is unclear, it is easy for the screen to become a collection of unrelated metrics.
It Is Built for a Specific Audience
Executives, managers, analysts, and frontline employees do not necessarily need the same level of detail.
The dashboard should reflect the decisions and responsibilities of the people using it.
It Focuses on Relevant KPIs
More information does not automatically create more insight.
The most important information should be easy to identify quickly.
It Gives Numbers Context
A metric without context can be misleading.
Where appropriate, dashboards should help users compare performance with a target, previous period, benchmark, or trend.
It Uses Clear Visuals
The objective of visualization is communication.
Charts should make the information easier to understand, not simply make the dashboard look sophisticated.
It Uses Trusted Data
A beautiful dashboard built on inaccurate, incomplete, duplicated, or inconsistently defined data can create false confidence.
Reliable dashboards depend on reliable underlying data and clear metric definitions.
It Helps Users Take Action
A dashboard should help users recognize what is normal, what has changed, what deserves investigation, and where action may be required.
What Makes a Dashboard Ineffective?
Dashboards often become less useful when organizations try to put too much information onto one screen.
Common problems include:
- too many KPIs,
- unclear metric definitions,
- cluttered charts,
- no targets or comparison points,
- outdated data,
- different systems showing conflicting numbers,
- irrelevant metrics,
- no clear audience, or
- no connection between the information and a business decision.
A dashboard should not become a storage location for every metric the organization can calculate.
The goal is clarity, not quantity.
Does a Data Dashboard Need Real-Time Data?
No.
Some dashboards benefit from real-time or near-real-time information, but others do not.
An operations team monitoring a time-sensitive process may need frequent updates.
An executive reviewing monthly financial performance may not.
The appropriate refresh frequency depends on how quickly the underlying information changes and how quickly someone needs to respond.
Dashboards can therefore use real-time updates or scheduled refreshes depending on the business requirement.
How Dashboards Can Create a Single View of Business Data
One of the most useful roles of a dashboard is bringing information from different business systems into a common view.
A company may have customer information in a CRM, financial information in accounting software, operational information in another application, and additional tracking in spreadsheets.
When those sources remain disconnected, employees may spend significant time manually combining information.
Dashboards can provide a common presentation layer across those sources when the underlying data and integrations are properly designed.
This is also why dashboard projects often overlap with systems integration.
The quality of the dashboard depends not only on the charts users see, but also on how reliably information reaches those charts.
What Tools Are Used to Build Data Dashboards?
There is no single dashboard platform that is automatically right for every organization.
Common approaches include business intelligence platforms such as Power BI and Tableau as well as custom-built dashboard solutions.
The appropriate approach depends on factors such as:
- existing data sources,
- number and type of users,
- required integrations,
- refresh frequency,
- security and access requirements,
- level of customization, and
- the organization’s existing technical environment.
The tool should follow the business requirements.
Choosing dashboard software before defining the audience, KPIs, and data sources can result in an attractive interface that does not answer the questions people actually need answered.
Does Your Business Need a Data Dashboard?
A dashboard may be worth considering if your team regularly:
- combines information from multiple spreadsheets,
- logs into several systems to understand performance,
- manually prepares the same reports every week or month,
- struggles to agree on which numbers are correct,
- discovers important performance changes too late,
- has difficulty tracking KPIs against targets, or
- spends more time collecting data than interpreting it.
However, building a dashboard is not automatically the first step.
Sometimes the underlying problem is inconsistent data, disconnected systems, or poorly defined KPIs.
Those issues should be understood before building the visualization layer.
How BlueSci Approaches Data Dashboards
At BlueSci, dashboard projects start with the business questions and KPIs the organization actually needs to monitor.
The objective is not to take every available number and place it on a screen.
We first identify the metrics that matter to the team and understand where the required information currently lives.
Depending on the project, this can include:
- KPI discovery to identify the metrics that matter most,
- integration with existing data sources such as CRM platforms, financial systems, and spreadsheets,
- custom dashboard design focused on clarity rather than clutter,
- real-time or scheduled data refresh based on business requirements,
- Power BI, Tableau, or custom-built dashboard solutions depending on the environment, and
- staff training so teams can read, filter, and use the information independently.
The result should be more than a visual report.
It should give the organization a clearer view of the information that drives decisions.
Learn more about BlueSci’s Data Solutions & Consulting.
Frequently Asked Questions About Data Dashboards
What is a data dashboard in simple terms?
A data dashboard is a visual screen that brings important business metrics, KPIs, charts, and other information together so users can understand performance more quickly.
Why is a data dashboard important?
A dashboard can make important information easier to access and understand, help teams monitor KPIs, identify trends or unusual changes, reduce repeated manual reporting, and support more informed decisions.
What is an example of a data dashboard?
A sales dashboard is one example. It might show revenue, pipeline value, conversion rates, average deal size, sales targets, and performance by region or salesperson in one view.
What are the four types of dashboards?
Dashboards are commonly grouped into operational, analytical, strategic, and tactical dashboards. The right type depends on the audience, business objective, time horizon, and decisions the dashboard needs to support.
What is the difference between a dashboard and a report?
A dashboard is typically designed for ongoing monitoring and may update automatically, while a report often provides more detailed information about a specific period or question. Businesses may use both for different purposes.
What is the difference between a KPI and a dashboard?
A KPI is a key performance indicator used to measure progress toward an important objective. A dashboard is the interface that can display one or more KPIs along with trends, comparisons, and supporting information.
Does a dashboard need to update in real time?
No. The appropriate refresh frequency depends on the business need. Some operational dashboards may require real-time or near-real-time updates, while strategic or financial dashboards may only need scheduled updates.
Can a dashboard pull data from multiple sources?
Yes. A dashboard can combine information from sources such as CRM systems, financial platforms, databases, spreadsheets, and other business applications when the required integrations are available.
What makes a good business dashboard?
A good dashboard has a clear purpose, is designed for a specific audience, focuses on relevant KPIs, gives metrics useful context, uses understandable visualizations, and relies on trusted data.
Can small businesses use data dashboards?
Yes. A dashboard can be useful for a smaller business when important information is spread across spreadsheets or software platforms and the team needs a simpler way to monitor performance.
What software can be used to build a data dashboard?
Dashboard solutions can be built using platforms such as Power BI and Tableau or through custom-built solutions. The appropriate option depends on the organization’s data sources, users, integrations, security requirements, and technical environment.
A Useful Dashboard Turns Data Into Something People Can Act On
So, what is a data dashboard and why does it matter?
A data dashboard brings important business information into a visual interface so people can understand performance without repeatedly searching through systems, spreadsheets, and reports.
But the charts themselves are not the most important part.
The real value comes from selecting the right KPIs, connecting reliable data, providing useful context, and presenting the information in a way that supports decisions.
A dashboard should help answer questions such as:
What is happening? Are we on target? What changed? Where should we look more closely? What requires action?
When a dashboard can answer those questions clearly, it becomes more than a visualization.
It becomes part of how the organization uses data to make decisions.
Related BlueSci Resources
- What Is Systems Integration and Why Does It Matter? — Learn how connected business systems can create a more reliable flow of information between applications.
- What Does an AI Consultant Actually Do? — Learn how businesses can identify practical opportunities for AI and build an implementation roadmap.
Related BlueSci Services
Ready to Turn Your Business Data Into a Clearer View?
Talk with BlueSci about your data sources, KPIs, and reporting challenges. We can help determine what your dashboard should track, how the data should connect, and which approach fits your business.
Start with the KPIs that matter. Build the dashboard around the decisions they support.
Related Articles
Turn this insight into an implementation plan.
Book a free consultation with BlueSci.